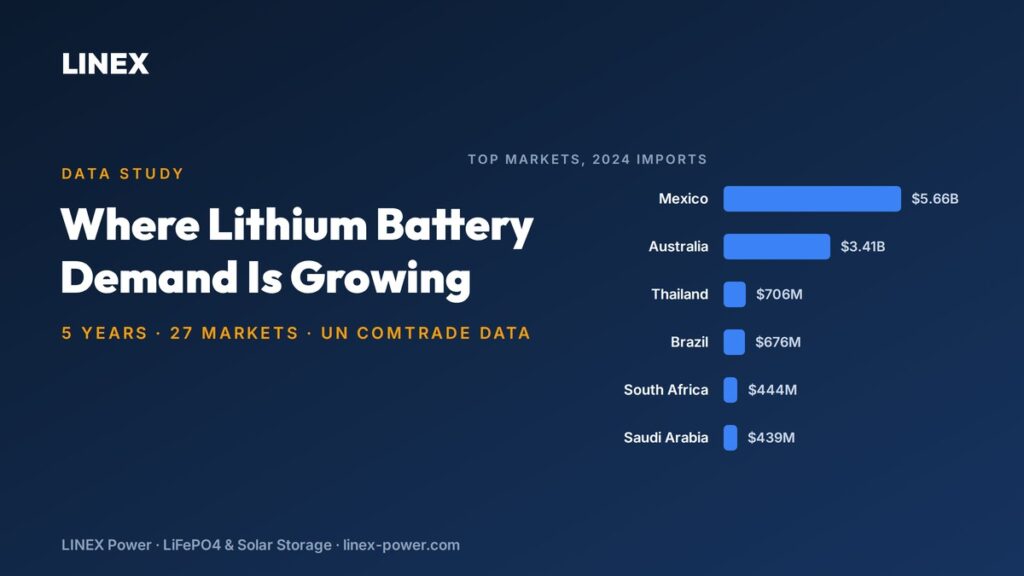
South Africa shows how quickly battery trade can change. Its lithium-ion battery imports rose from $172.3M in 2020 to $1.75B in 2023, then settled at $444.0M in 2024. Across the 22 markets with complete five-year records, the broader direction was still firmly upward: combined imports increased from $2.94B in 2020 to $12.99B in 2024.
We analyzed UN Comtrade customs data for lithium-ion batteries under HS 850760 across 27 markets. The study covers 2020–2024 import values and the share supplied by China. These are reported customs values, not market-size estimates. It expands our first 7-market snapshot by adding more countries and a five-year view. Twenty-two markets have data for both 2020 and 2024; partial reporters are shown separately rather than included in growth comparisons.
For distributors, importers and project buyers, the figures help separate sustained demand from a single-year surge. They also show where Chinese supply is deeply established and where sourcing is more diversified. That context matters when assessing order timing, inventory exposure and the level of supplier due diligence required. It is particularly relevant for buyers planning battery sourcing for solar projects or evaluating suppliers for recurring distribution orders.
The big picture: five years of demand
Combined imports across the 22 complete markets climbed each year: $2.94B in 2020, $4.73B in 2021, $7.26B in 2022, $9.93B in 2023 and $12.99B in 2024. That is a 342% increase over five years. Across all 27 markets and all available reporting years, the dataset contains $51.58B in tracked trade, although incomplete reporting means that figure should not be treated as a five-year total for a fully consistent country group.
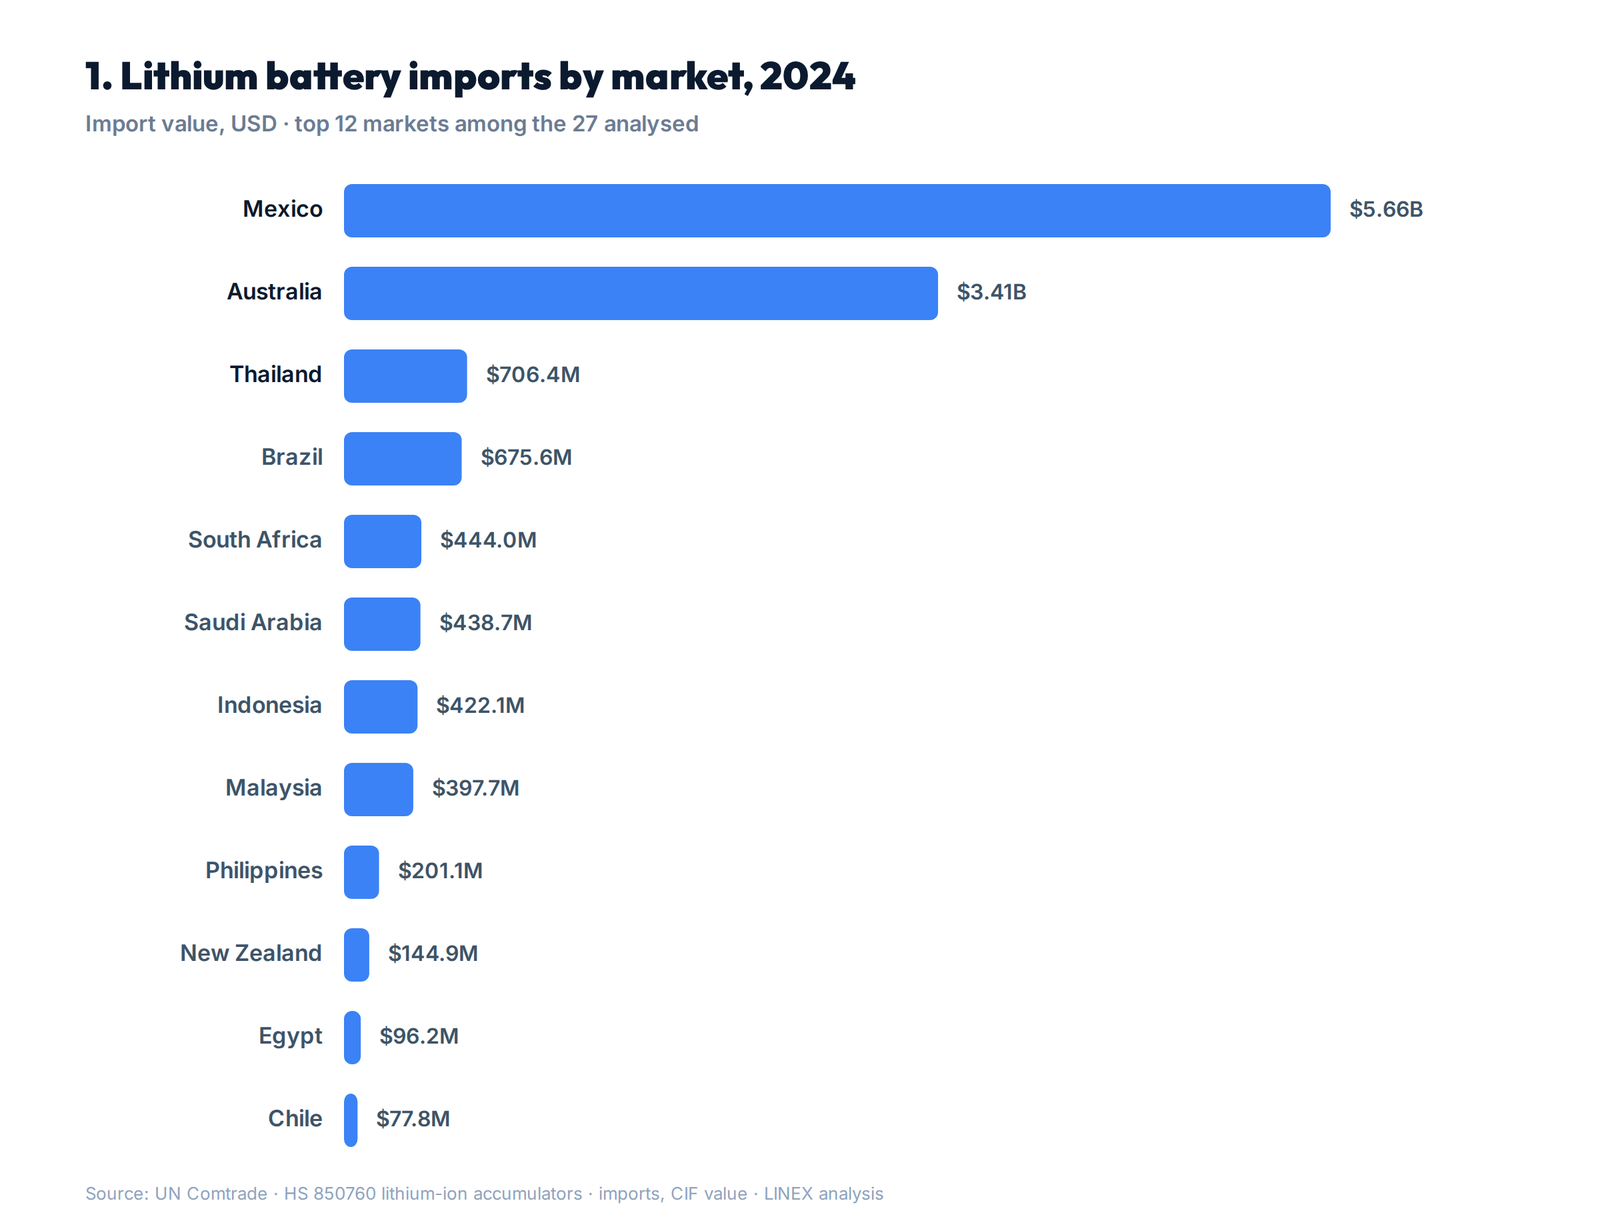
Growth was concentrated at the top. Mexico expanded from $816.0M to $5.66B, while Australia rose from $345.4M to $3.41B. Thailand and Brazil also finished 2024 above $675M, and South Africa, Saudi Arabia, Indonesia and Malaysia each exceeded $397M. The spread across Latin America, Asia-Pacific, Africa and the Gulf is consistent with battery demand serving several use cases, including transport, solar storage and telecom power, rather than one uniform regional cycle.
Who grew fastest, who cooled off
Mexico delivered the largest absolute increase among the complete markets, moving from $816.0M in 2020 to $5.66B in 2024. Australia followed with growth from $345.4M to $3.41B. The fastest percentage increase came from Egypt at 1,251%, although its smaller starting value of $7.1M makes that rate different in scale from the gains in Mexico or Australia. Other rapid percentage growers included Australia at 887%, Saudi Arabia at 763%, Tanzania at 690% and Mexico at 594%.
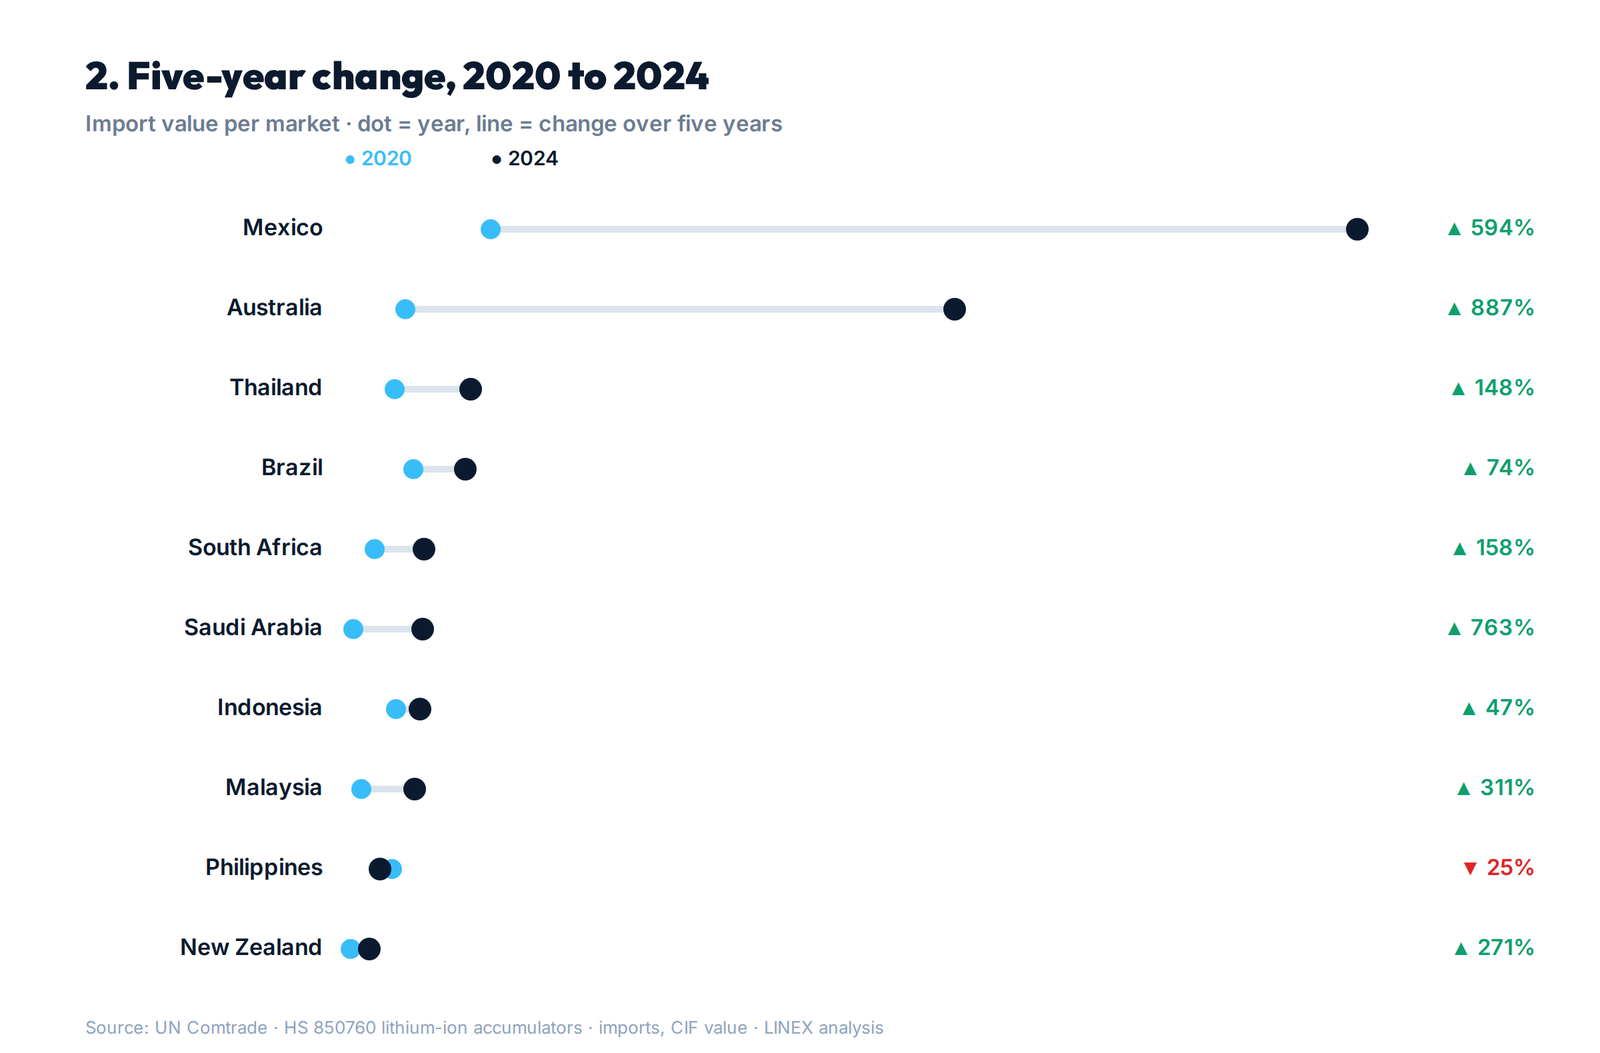
Several mid-sized markets also moved decisively. Malaysia increased 311% to $397.7M, New Zealand rose 271% to $144.9M, Peru gained 264% to $50.9M and Chile grew 250% to $77.8M. These figures point to widening demand beyond the largest destinations, but they do not reveal the application mix within each HS 850760 total. Buyers selecting products such as 48V lithium batteries still need to validate local voltage, certification, cycle-life and installation requirements rather than treating customs growth as a product specification.
Only two complete markets declined between 2020 and 2024. The Philippines fell 25%, from $266.6M to $201.1M, while Nigeria declined 20%, from $50.1M to $40.2M. Nigeria’s result is consistent with currency and import pressures affecting purchasing capacity, though the customs data alone cannot establish the cause. South Africa remained 158% above its 2020 level despite its sharp retreat from the 2023 peak, suggesting normalization after an exceptional import year, likely linked in part to severe power constraints and accelerated backup-energy demand.
| Market | 2020 total | 2024 total | Change | 2024 from China | China share |
|---|---|---|---|---|---|
| Mexico | $816.0M | $5.66B | +594% | $719.5M | 13% |
| Australia | $345.4M | $3.41B | +887% | $1.66B | 49% |
| Thailand | $284.9M | $706.4M | +148% | $517.6M | 73% |
| Brazil | $388.5M | $675.6M | +74% | $541.0M | 80% |
| South Africa | $172.3M | $444.0M | +158% | $411.6M | 93% |
| Saudi Arabia | $50.9M | $438.7M | +763% | $426.0M | 97% |
| Indonesia | $287.9M | $422.1M | +47% | $359.7M | 85% |
| Malaysia | $96.7M | $397.7M | +311% | $250.7M | 63% |
| Philippines | $266.6M | $201.1M | -25% | $98.7M | 49% |
| New Zealand | $39.1M | $144.9M | +271% | $101.2M | 70% |
| Egypt | $7.1M | $96.2M | +1,251% | $43.4M | 45% |
| Chile | $22.2M | $77.8M | +250% | $57.9M | 74% |
| Pakistan | $32.7M | $60.1M | +84% | $59.4M | 99% |
| Peru | $14.0M | $50.9M | +264% | $44.8M | 88% |
| Colombia | $25.7M | $49.8M | +94% | $40.6M | 81% |
| Nigeria | $50.1M | $40.2M | -20% | $23.3M | 58% |
| Kenya | $14.6M | $34.0M | +133% | $28.4M | 84% |
| Tanzania | $3.0M | $23.8M | +690% | $15.3M | 64% |
| Oman | $3.3M | $17.2M | +419% | $6.0M | 35% |
| Qatar | $5.7M | $15.9M | +180% | $9.9M | 62% |
| Sri Lanka | $7.0M | $14.5M | +106% | $11.6M | 80% |
| Kuwait | $6.9M | $9.4M | +36% | $5.5M | 59% |
| Ghana | n/a | $6.0M | n/a | $4.0M | 68% |
| Iraq | n/a | $3.8M | n/a | $2.8M | 73% |
| Vietnam | $2.21B | n/a | n/a | n/a | n/a |
| UAE | $109.7M | n/a | n/a | n/a | n/a |
| Bangladesh | n/a | n/a | n/a | n/a | n/a |
Where the supply comes from: China’s share
China is a major source in most of the larger markets, but the pattern is not uniform. In 2024, China supplied 13% of Mexico’s $5.66B, 49% of Australia’s $3.41B, 73% of Thailand’s $706.4M, 80% of Brazil’s $675.6M, 93% of South Africa’s $444.0M, 97% of Saudi Arabia’s $438.7M, 85% of Indonesia’s $422.1M, 63% of Malaysia’s $397.7M, 49% of the Philippines’ $201.1M, 70% of New Zealand’s $144.9M, 45% of Egypt’s $96.2M and 74% of Chile’s $77.8M. The spread points to more diversified sourcing in Mexico, Australia, the Philippines and Egypt, while South Africa, Saudi Arabia, Brazil and Indonesia rely more heavily on China-origin supply.
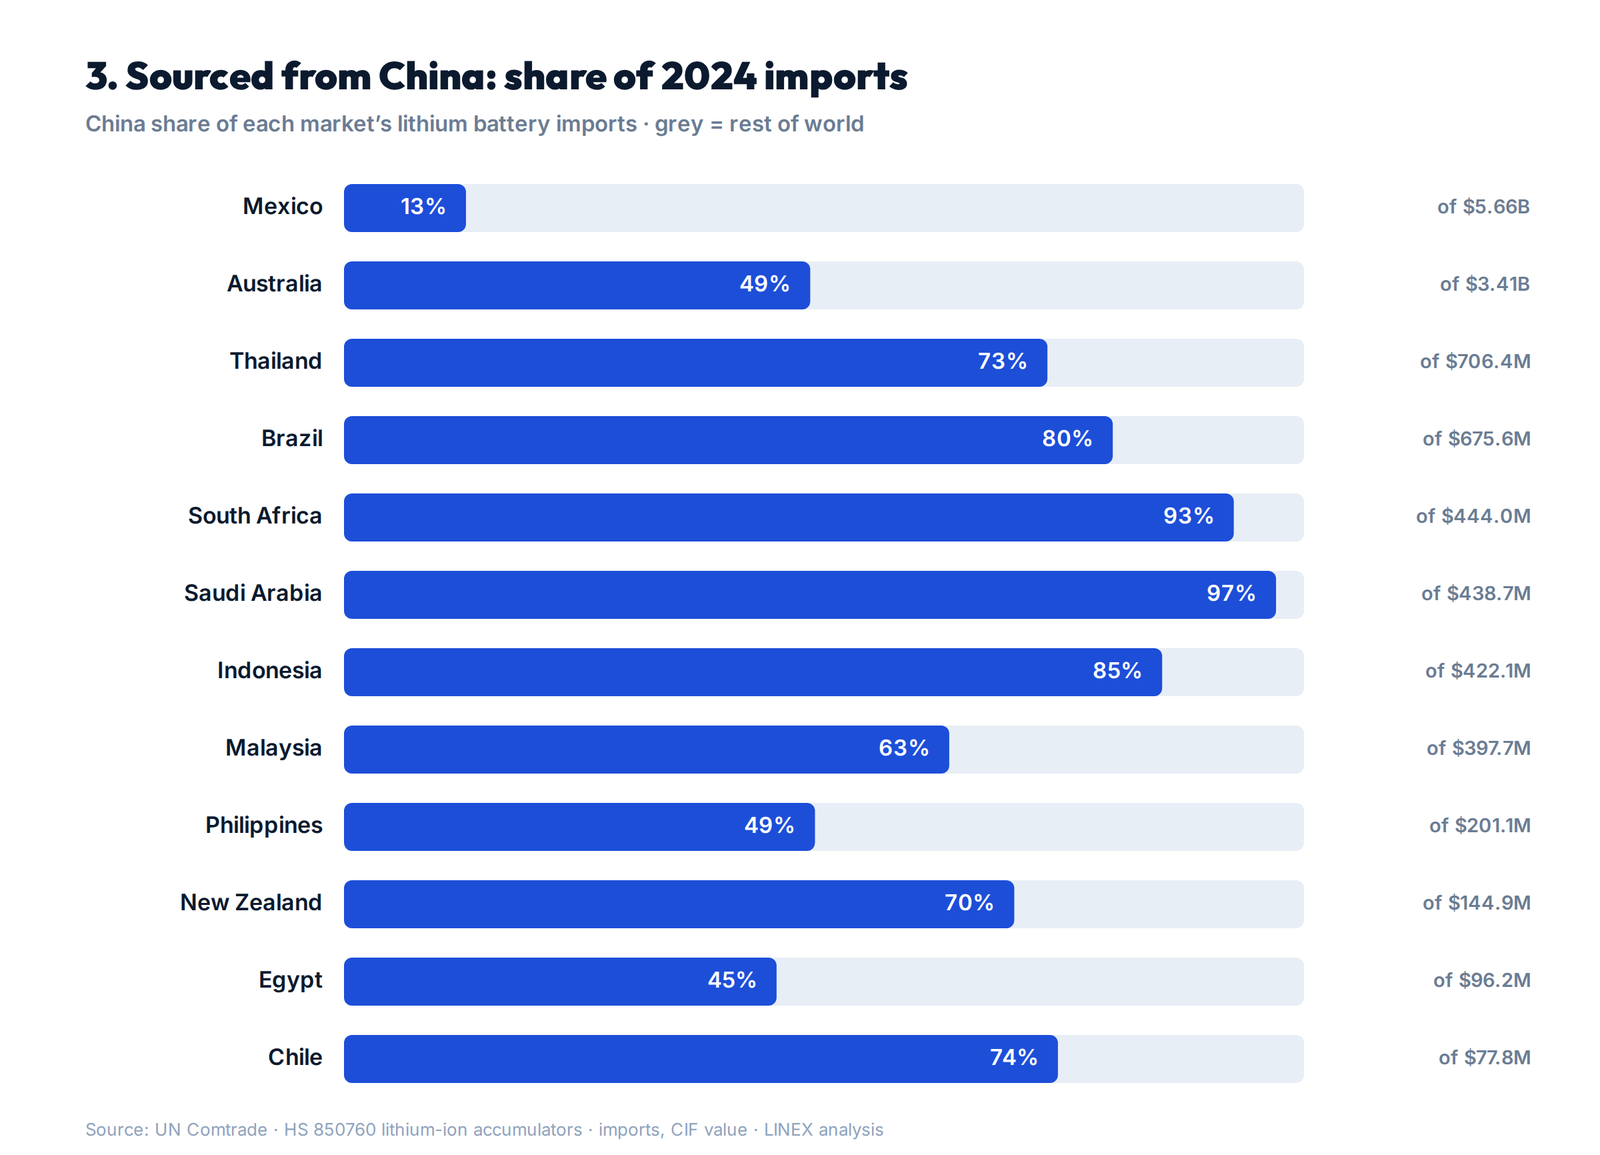
Across the full 27-market study, tracked imports total $51.58B across 2020–2024. The cleanest like-for-like China-share measure comes from the 22 markets with both 2020 and 2024 data: China-origin imports rose from $1.47B to $5.43B, while its share fell from 50% to 42%. That suggests total import growth outpaced China-origin growth in the comparable group, although the data does not identify which alternative suppliers gained share. The 42% figure should therefore be read as the comparable 2024 result for the complete markets, not as a complete 27-market share.
The trend lines that matter
Six markets show how different the underlying paths can be. Mexico rose each year from $816.0M in 2020 to $1.80B in 2021, $2.71B in 2022, $3.90B in 2023 and $5.66B in 2024. Australia moved from $345.4M to $745.9M, $1.08B, $1.59B and $3.41B. Thailand climbed from $284.9M to $335.1M, $427.3M, $478.0M and $706.4M. Brazil increased from $388.5M to $474.4M, $575.9M, $575.4M and $675.6M.
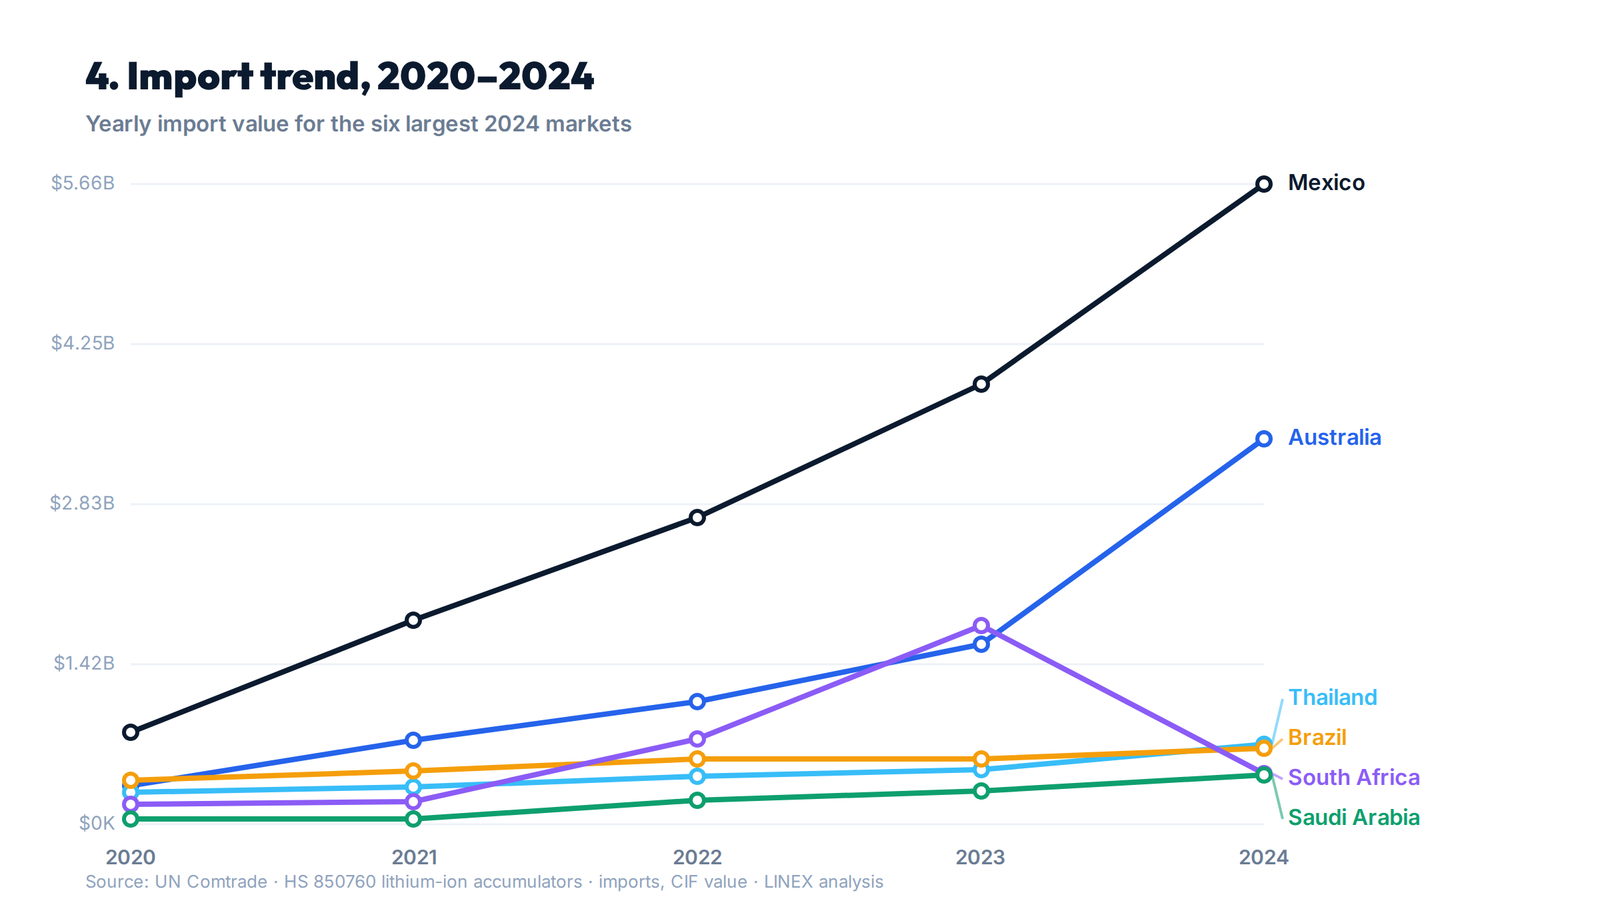
The divergence becomes clearer in South Africa and Saudi Arabia. South Africa moved from $172.3M in 2020 to $203.6M in 2021, $759.0M in 2022, $1.75B in 2023 and $444.0M in 2024. Saudi Arabia was almost flat at $50.9M and $49.9M in 2020–2021, then rose to $215.7M, $296.7M and $438.7M. Mexico, Thailand and Saudi Arabia show sustained upward movement after different starting points, while South Africa shows a sharp spike followed by normalization. Brazil sits between those patterns, with growth interrupted by a flat 2023.
What this means if you buy or distribute batteries
The first purchasing lesson is to separate volume from momentum. Mexico and Australia dominate the 2024 list at $5.66B and $3.41B, while the next group ranges from Thailand’s $706.4M to New Zealand’s $144.9M. Growth is also spreading into smaller markets: Malaysia reached $397.7M, Egypt $96.2M, Tanzania $23.8M, Oman $17.2M and Chile $77.8M in 2024. That supports a two-track approach: protect capacity for the largest markets, then test smaller markets where demand is growing but volumes remain manageable.
South Africa remains a leading emerging-market buyer, even after its 2024 value fell to $444.0M from $1.75B in 2023. Its 2024 imports were still above Saudi Arabia at $438.7M, Indonesia at $422.1M and Malaysia at $397.7M. We would treat the decline as normalization after an exceptional surge, not proof that demand has disappeared. Inventory plans should use $444.0M as the latest reference point and treat the 2022–2023 values as evidence of volatility.
The China-share number should guide sourcing structure, not dictate it. A 97% China share in Saudi Arabia and 93% in South Africa point to deep dependence on China-origin supply; 13% in Mexico and 49% in Australia leave more room to compare origins, landed cost, compliance and service. Whatever route you choose, supplier vetting matters. Cell chemistry, usable capacity, BMS limits, certifications, warranty terms and after-sales support can change the real economics more than a small difference in headline price. See our guide to choosing a lithium battery supplier in China for practical checks.
Product fit should follow the application. A 12V lithium battery can suit smaller backup, mobile or light off-grid applications, while a 48V lithium battery is more relevant to telecom, residential storage and larger DC loads. New-market entries reward buyers who study the numbers before shipping containers: confirm who buys, at what scale, from which origins, and whether the latest series looks steady or distorted by a one-year spike.
Quick answers
Mexico led the 2024 data at $5.66B, followed by Australia at $3.41B. Thailand reached $706.4M and Brazil reached $675.6M.
The customs data does not prove a single cause. Imports rose from $172.3M in 2020 to $1.75B in 2023, then fell to $444.0M in 2024, showing a spike followed by normalization.
Across the 22 complete markets, China supplied $5.43B in 2024, equal to 42% of imports. In 2020, the figure was $1.47B and a 50% share.
Yes, across the 22 markets with both years available. Combined imports rose from $2.94B in 2020 to $4.73B in 2021, $7.26B in 2022, $9.93B in 2023 and $12.99B in 2024, a five-year increase of 342%.
Start with market size, sourcing concentration and data completeness. Mexico had a 13% China share in 2024, Saudi Arabia had 97%, and Vietnam has only 2020 data, so demand and sourcing assumptions should be checked separately.
Egypt grew by 1,251%, Australia by 887%, Saudi Arabia by 763%, Tanzania by 690% and Mexico by 594%. These comparisons use only markets with both 2020 and 2024 values.
The Philippines fell from $266.6M to $201.1M, a decline of 25%, while Nigeria fell from $50.1M to $40.2M, down 20%. South Africa also ended 2024 below its 2023 peak, moving from $1.75B to $444.0M.
Not for a 2020–2024 growth comparison. Vietnam has $2.21B for 2020 only, the UAE has $109.7M for 2020 only, Ghana and Iraq have 2024-only data, and Bangladesh has no reported value in this study.
How we pulled the data
The numbers in this article come from UN Comtrade, where national customs agencies report their trade records to the United Nations. We looked at one category: HS 850760, lithium-ion cells and batteries. The data covers 27 markets from 2020 through 2024, and 2024 is the latest full year available. The values are declared imports (CIF), not retail prices. We also tracked China’s share of those imports.
- Twenty-two markets reported in both 2020 and 2024, so the growth comparisons use that group. Vietnam and the UAE have 2020 data only; Ghana and Iraq have 2024 data only.
- Customs records can arrive late, and re-exports may inflate a market total.
- Trade values don’t show product mix, margins or end use.
For a market-specific battery discussion based on your target country, voltage and application, contact LINEX.